Avascular Necrosis (AVN) of the Femoral Head: Findings on MRI
Traumatic or atraumatic disruption of blood supply to the proximal femur (for full pathogenesis, see Calgary Guide slide Avascular Necrosis: Pathogenesis and clinical findings)
Ischemia of the femoral head (usually unilateral for traumatic and bilateral for non-traumatic)
Prolonged anoxia (total oxygen deprivation) within the femoral head
Cell death (necrosis) of osteocytes and marrow cells in the femoral head, forming a focal lesion (sequestrum)
Histiocytes and giant cells (immune cells) aggregate around the sequestrum, forming a “reactive zone” around the periphery of the sequestrum
Apoptotic osteocytes in the anoxic reactive zone cannot be phagocytosed leading to dysregulated bone remodeling and osteosclerosis (hardening of bone and ↑ bone mineralization and density due to ↓ resorption and ↑ bone formation)
Femoral head becomes progressively weaker while the mechanical load on it remains the same
Progressive femoral head/subchondral bone collapse Osteoarthritis
Areas with ↑ fluid content appear darker on T1w images
Areas with ↑ fluid content appear brighter on T2w images
Areas with ↑ bone density and ↓ fat content appear darker on T1w images
Areas with ↑ bone density and ↓ fat content appear darker on T2w images
Basic MRI Physiology
Edema and inflammation increases fluid content
Sclerotic areas have ↑ bone density and thus ↓ fat content
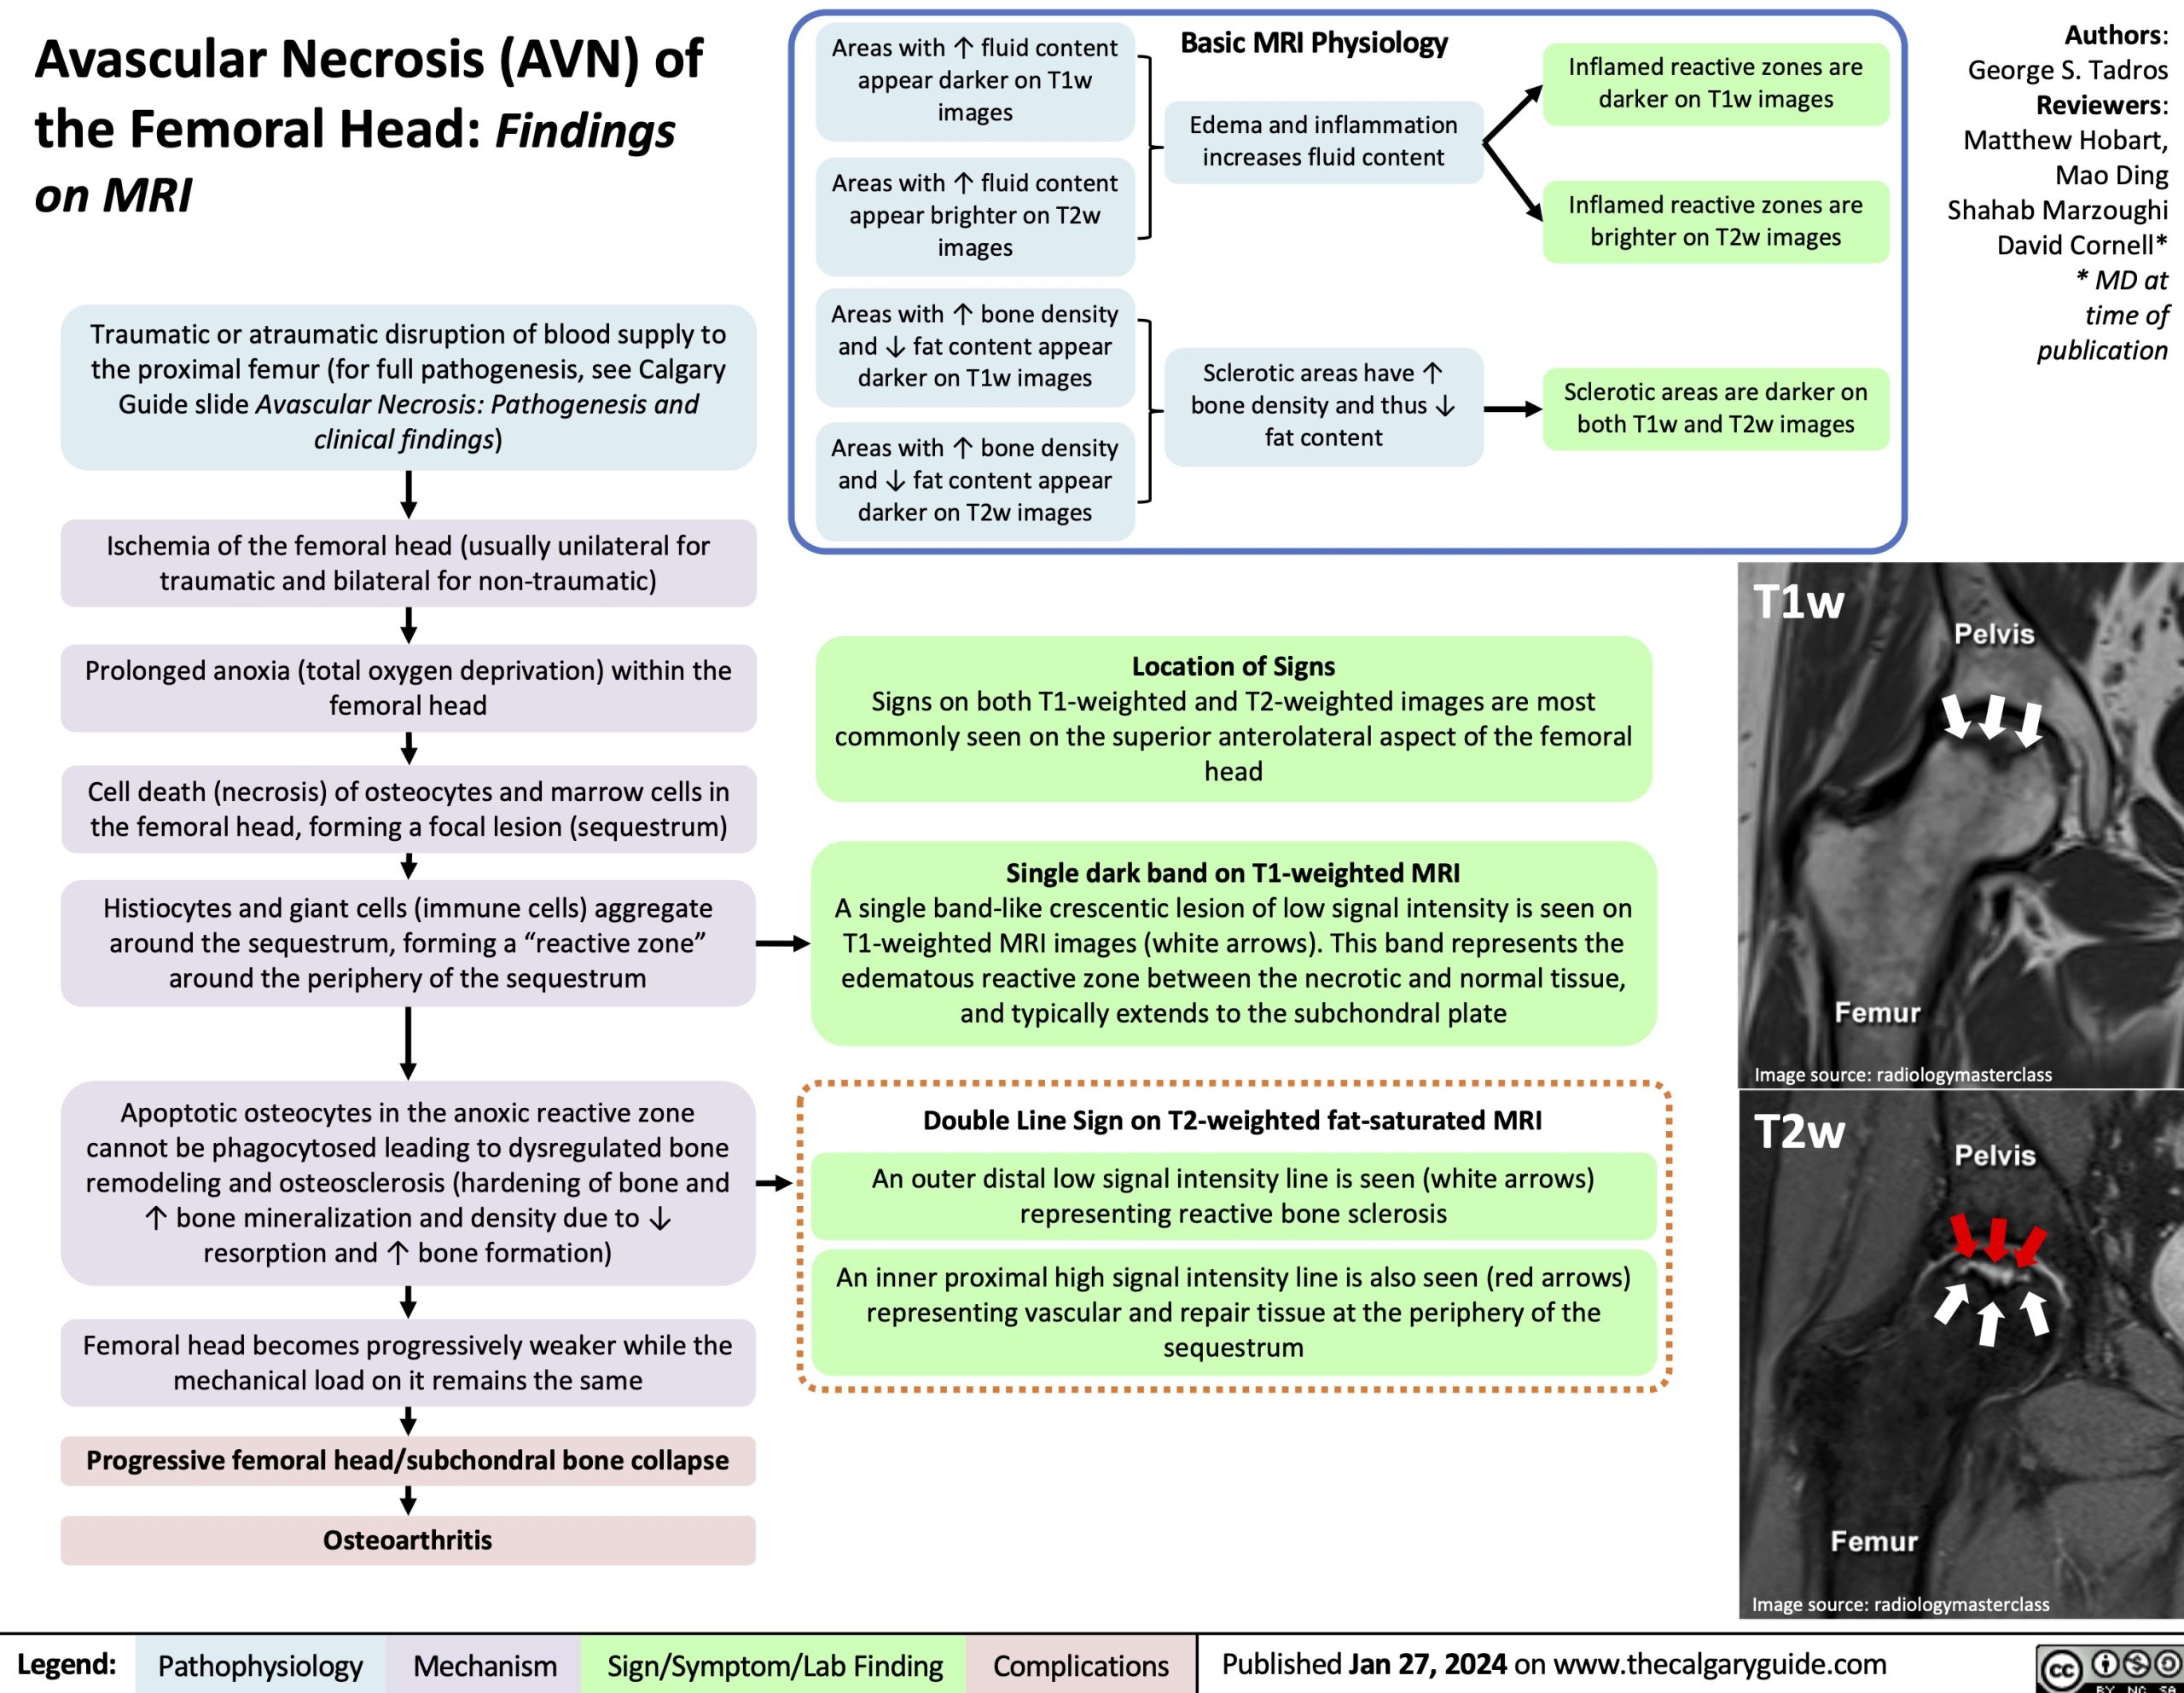
Location of Signs
Inflamed reactive zones are darker on T1w images
Inflamed reactive zones are brighter on T2w images
Sclerotic areas are darker on both T1w and T2w images
Authors: George S. Tadros Reviewers: Matthew Hobart, Mao Ding Shahab Marzoughi David Cornell* * MD at time of publication
T1w
Signs on both T1-weighted and T2-weighted images are most commonly seen on the superior anterolateral aspect of the femoral head
Single dark band on T1-weighted MRI
A single band-like crescentic lesion of low signal intensity is seen on T1-weighted MRI images (white arrows). This band represents the edematous reactive zone between the necrotic and normal tissue, and typically extends to the subchondral plate
Double Line Sign on T2-weighted fat-saturated MRI
An outer distal low signal intensity line is seen (white arrows) representing reactive bone sclerosis
Image source: radiologymasterclass
T2w
An inner proximal high signal intensity line is also seen (red arrows) representing vascular and repair tissue at the periphery of the sequestrum
Image source: radiologymasterclass
Legend:
Pathophysiology
Mechanism
Sign/Symptom/Lab Finding
Complications
Published Jan 27, 2024 on www.thecalgaryguide.com